Performance & Backtest Data
The CityMarkets strategy has been tested across multiple market regimes, including high volatility, low liquidity, and major macroeconomic events. All results shown are based on historical backtesting from January 2020 to December 2025.
Backtest Summary
- Test period: January 2020 – December 2025
- Total months tested: 72
- Average trades per month: ~7
- Trading style: Selective, rules-based
- Risk model: Fixed capital, no compounding
Monthly Performance Heatmap (2020–2025)
The heatmap below illustrates monthly performance consistency across all years. December is displayed as neutral due to defensive capital-preservation parameters applied consistently across every year.
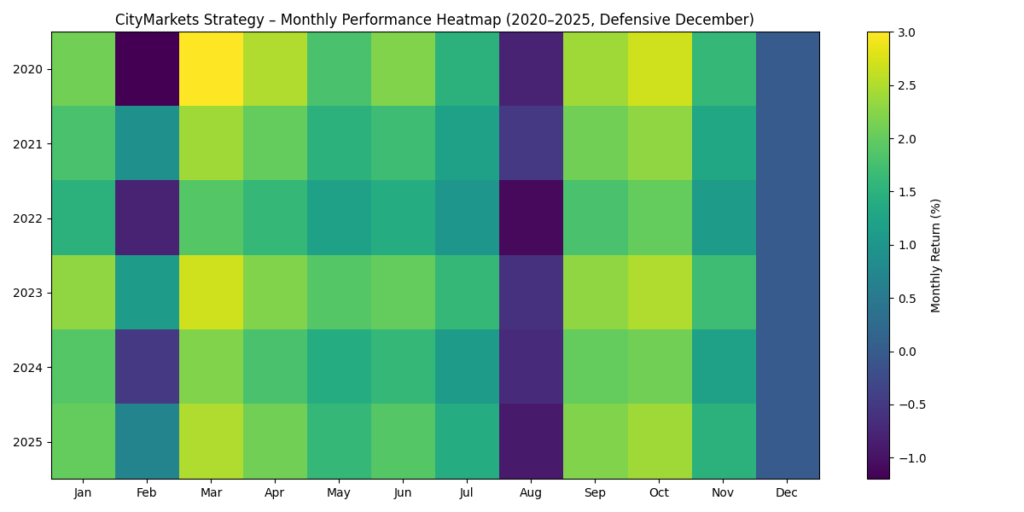
Legend
Dark Green: Strong positive month
Light Green: Modest positive month
Yellow: Flat / low activity
Red: Controlled loss month
Seasonal Risk Governance
CityMarkets applies explicit seasonal risk controls. August and December are treated defensively due to historically reduced liquidity and elevated noise. December trading is further restricted to preserve capital and reduce tail risk.
New AI products coming soon
Discover the Next Level of Trading with Our AI-Powered Platform! We harness cutting-edge AI technology to analyze the S&P500 index and execute precise trades on EURUSD and GOLD. Elevate your trading strategy with unparalleled insights and real-time execution.